The given graph shows the number of books read by pupils in a class from July to December. Study the given graph and answer the following question.
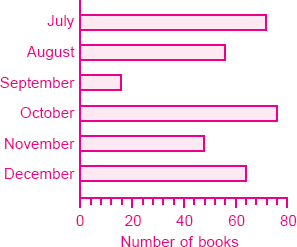
How many books were read altogether from July to November?
A 242
B 260
C 258
D 268
The given graph shows the number of books read by pupils in a class from July to December. Study the given graph and answer the following question.
How many books were read altogether from July to November?
A 242
B 260
C 258
D 268